- Prompt/Deploy
- Posts
- How Do I Know It's Failing?
How Do I Know It's Failing?
Detection before it's too late. An interactive guide to setting up failure detection for AI systems.
Hou C.
March 12, 2026
This post is part of the Mental Models for Production AI series, which explores the mental frameworks needed to evaluate, build, operate, and improve AI-powered features—focusing on practical decision-making.
Your dashboards are green. Latency is normal. Error rate is flat. Then a user reports a bad response, and you're left wondering: was that a one-off, or has quality been drifting for weeks?
The uncomfortable answer: without the right detection in place, you can't tell. AI incidents take an average of 4.5 days to detect, compared to 2.3 days for traditional security incidents. The gap comes from the same property described in the previous post on failure cascades—AI failures are semantically invisible. The system returns HTTP 200. The response looks well-formatted. The content is wrong.
This post is a decision tree with four gates. Walk through them in order. Each "no" tells you exactly what to add. The whole thing takes about fifteen minutes with a whiteboard.
Why Detection Is Its Own Problem
It's tempting to monitor AI features the way we monitor any service: latency, error rates, uptime, cost. Those metrics matter, but they only cover the infrastructure layer. They'll tell you if the service is down. They won't tell you if the outputs are wrong.
According to the GLACIS AI incident response framework, 67% of AI incidents stem from model errors rather than adversarial attacks. That means the majority of failures look perfectly healthy from an infrastructure perspective. Quality monitoring—measuring whether the outputs are actually good—matters more than threat detection for most teams.
The decision tree below walks through four layers of detection, building from the most basic ("can you measure quality at all?") to comprehensive ("do you know what to do when something breaks?").
How to Read This Tree
A few things before walking through it:
The gates are sequential. Start at Gate 1. If you pass, move to Gate 2. Earlier gates catch gaps that make later gates irrelevant—alerting on quality drops is meaningless if you're not measuring quality.
Every "no" leads to a concrete action. Each NO path tells you what to add, not just what you're missing.
Passing all four gates means "good shape," not "done." Detection is a spectrum. You'll keep tuning thresholds, expanding coverage, and reducing detection latency over time.
This maps to the failure cascade. If you've read the previous post on failure cascades, each gate corresponds to detection at those boundaries. If you haven't, no
worries—the tree stands on its own. Gate 1 is about detecting quality issues at the output boundary. Gate 2 is about knowing whether what you're seeing is normal. Gates 3 and 4 are about acting on what you detect.
Gate 1: Can You Measure Output Quality Automatically?
The first question: do you have any automated way to tell if outputs are good?
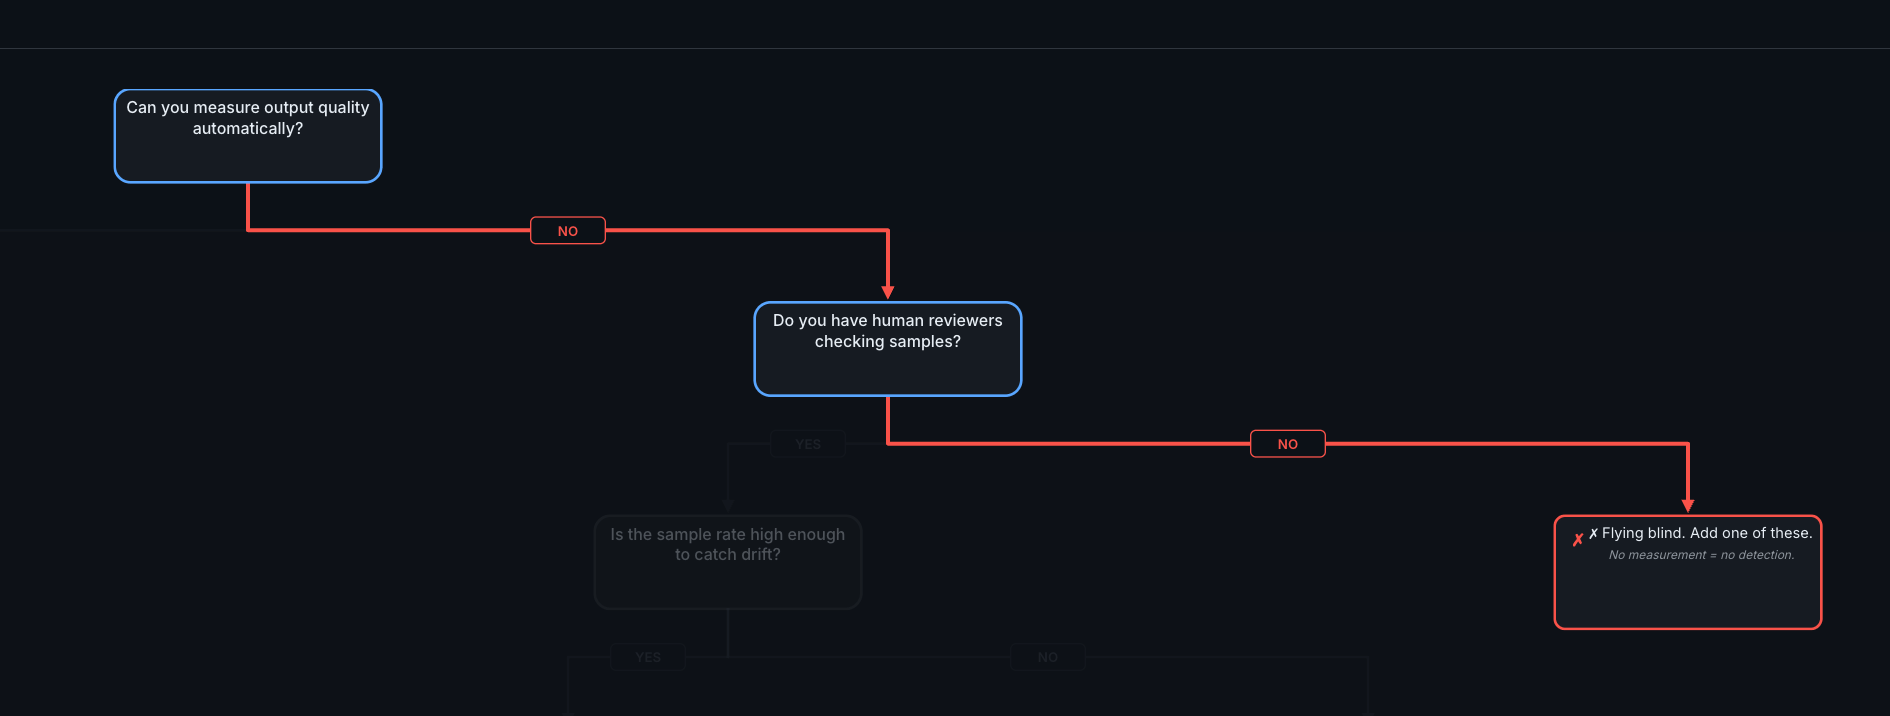
Gate 1. If you can't measure quality automatically and don't have human reviewers, you're flying blind.
YES → Continue to Gate 2
Automated quality measurement comes in layers, roughly ordered from cheapest to most sophisticated:
Lightweight checks on 100% of traffic:
Schema/format validation (is the output valid JSON? Does it have the expected fields?)
Length checks (unusually short or long responses often signal problems)
Toxicity and safety filters
Scope checks (does the response stay within the feature's domain?)
LLM-as-judge evaluations on 5-10% of traffic:
Faithfulness: are the claims in the output supported by the retrieval context?
Relevance: does the output actually address the question?
Coherence: does the output make sense as a whole?
These typically cost in the range of $0.01–0.10 per evaluation—roughly 500x cheaper than human review—and reach approximately 80% agreement with human preferences. That ceiling is worth noting: even human reviewers agree with each other only about 80% of the time, so expecting higher from automated evaluation isn't realistic. At high traffic volumes, even cheap evaluations add up—sampling (5-10%
rather than 100%) keeps costs manageable while still catching patterns.
Behavioral signals on 100% of traffic:
Re-generation rates (users clicking "regenerate" signals dissatisfaction)
Conversation length anomalies (users rephrasing may indicate poor initial answers)
Explicit feedback (thumbs up/down)
💡 Tip: Start with the lightweight checks. They catch structural failures immediately and cost almost nothing. Add LLM-as-judge evaluations once you have the infrastructure to run them asynchronously—evaluation should never
block user requests.
NO → Do you have human reviewers checking samples?
If you don't have automated measurement, the fallback is human review. Some teams start here intentionally, especially for features where quality is subjective.
YES (human reviewers): Is the sample rate high enough to catch drift? A practical target for a feature handling hundreds to thousands of daily requests is about 100 interactions per week, using smart sampling—focus on edge cases and AI-flagged items rather than purely random selection. Scale the sample rate to your traffic: higher-stakes features with lower volume may warrant reviewing a larger percentage. If your sample rate is too low, increase it or supplement with automated checks.
NO (no human reviewers): You're flying blind. No measurement means no detection. Start with the cheapest option: log all inputs and outputs, then manually review 50 random samples per week. That alone will reveal patterns you didn't know existed.
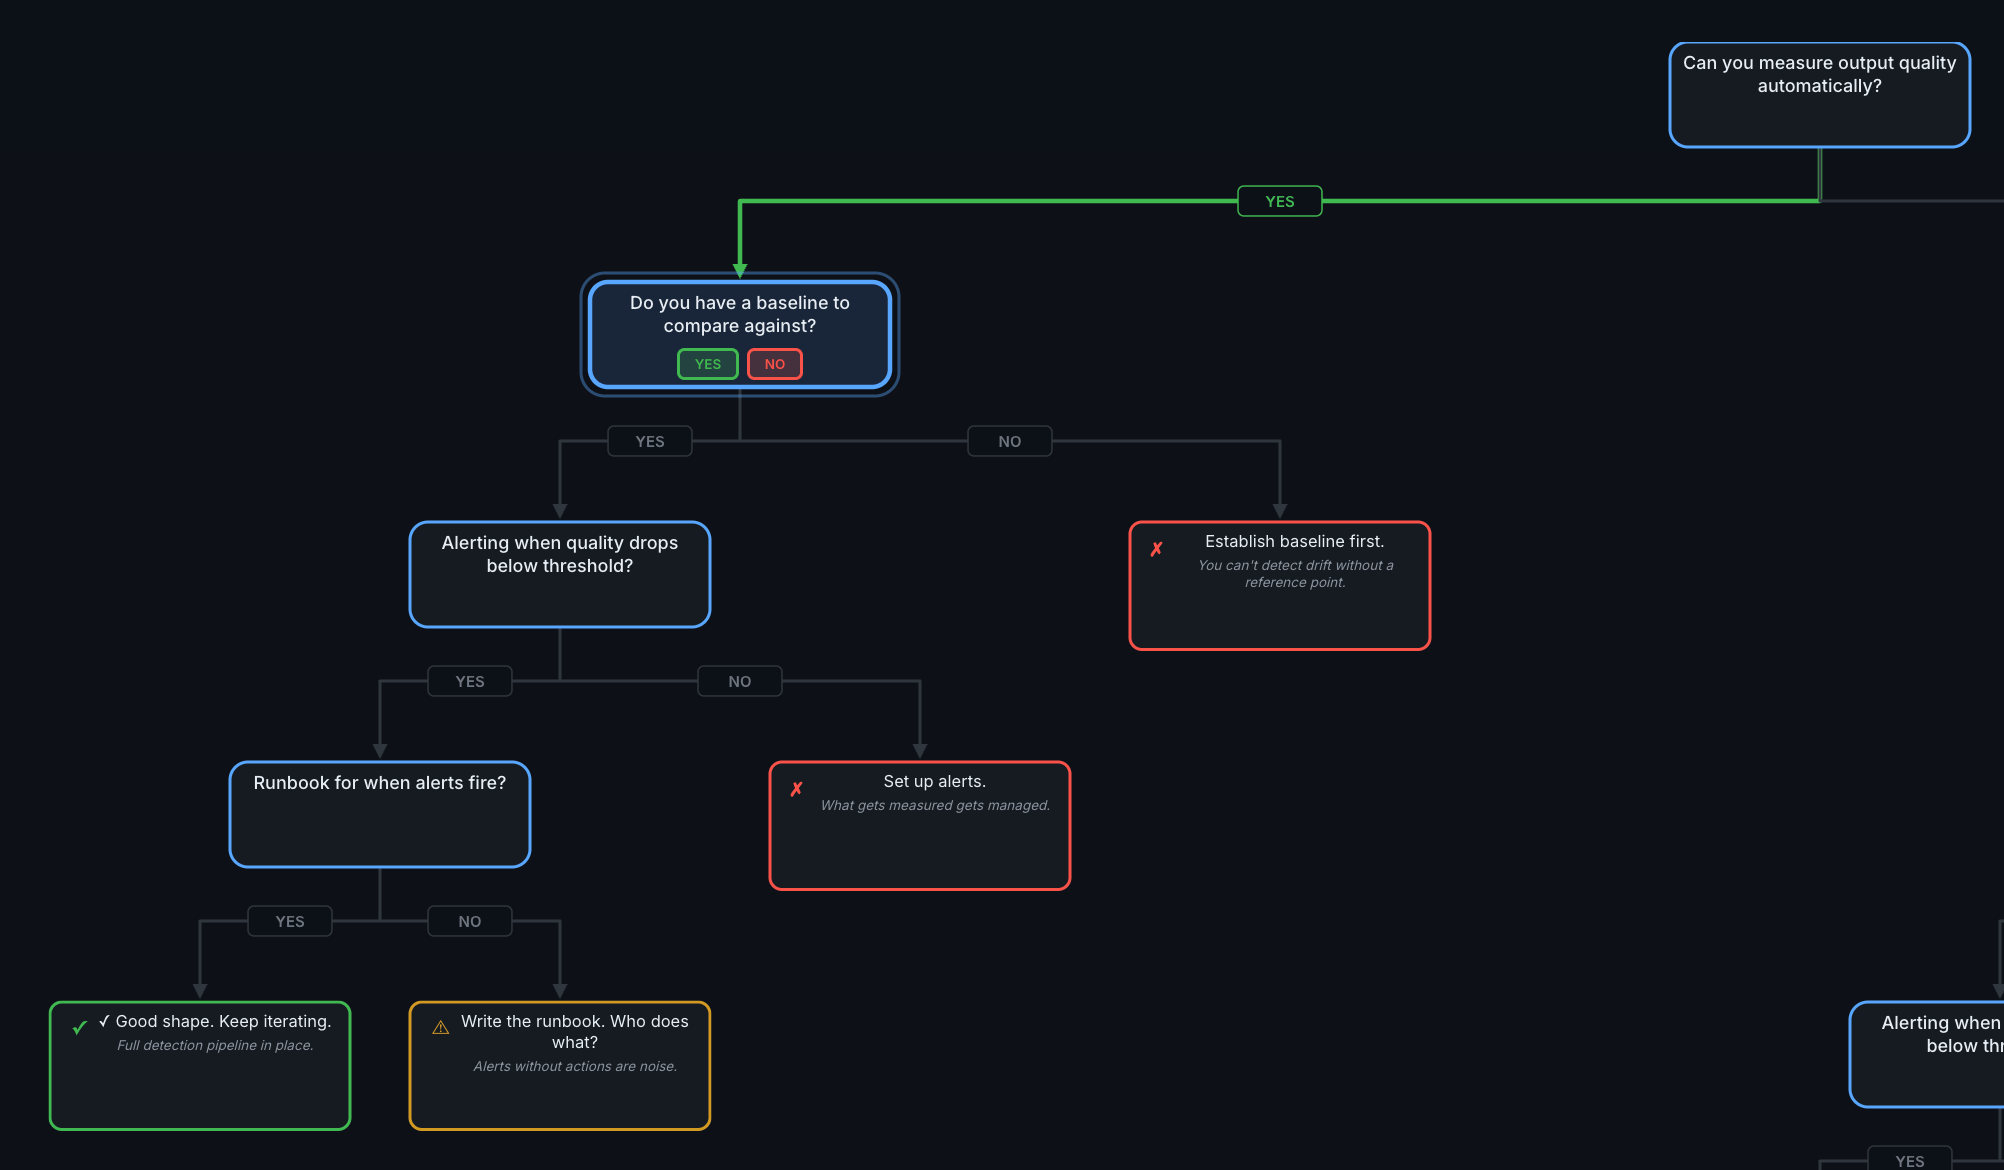
Gate 2: Do You Have a Baseline to Compare Against?
You can measure quality. But do you know what "normal" looks like?
The YES path through the full tree. Gate 2 asks whether you have a reference point for "normal."
YES → Continue to Gate 3
A baseline is a snapshot of your quality scores during a stable period. It answers the question: "when things are working well, what do the numbers look like?"
Establishing a baseline means:
Running your quality checks on 2-4 weeks of production traffic
Recording average scores and their variance
Creating a reference dataset of representative queries
Once you have a baseline, drift detection becomes possible. Start simple and add sophistication as needed:
Simple comparison (start here): Compare this week's average quality scores to your baseline. A sustained drop of 5-10% is worth investigating.
Statistical approaches: Population Stability Index (PSI) highlights changes in input distributions. KL Divergence measures how much current traffic differs from the training distribution. These are more precise but require more infrastructure.
Embedding-based detection: Compare the semantic meaning of inputs and outputs across time windows using cosine similarity. Drifting embeddings signal that either user behavior or model behavior is changing.
One common trigger for drift: model provider updates. When your LLM provider pushes a new model version, behavior can shift without any change on your side. Baselines help you detect this—compare quality scores before and after the update window.
NO → Establish baseline first.
You can't detect drift without a reference point. Run your quality checks on the last 2-4 weeks of traffic and record the scores. That becomes your baseline. If your traffic varies significantly by day or season, capture a period that includes that variation—a baseline built on an unusually quiet week will trigger false alarms once normal traffic resumes.
Gate 3: Alerting When Quality Drops Below Threshold?
You measure quality and have a baseline. Does anyone get notified when things degrade?
YES → Continue to Gate 4
What good alerting looks like, organized by urgency:
Tier | Triggers | Response Time |
|---|---|---|
Tier 1 (immediate) | Error rate spikes, safety/toxicity violations, complete output failures | Minutes |
Tier 2 (urgent) | Quality score drops >10% from baseline, cost spikes >20%, latency degradation >15% | Hours |
Tier 3 (monitoring) | Gradual drift trends, minor relevance decreases (~5%), token usage changes | Daily review |
These thresholds are starting points. Every deployment is different—a 5% quality drop might be noise for one feature and a crisis for another. The right thresholds depend on the stakes (how much does a wrong answer cost?) and the baseline variance (how much does quality naturally fluctuate?). Start with the thresholds above and tune based on what you see.
💡 Tip: Run evaluations asynchronously. Log all requests immediately, then score them in a background pipeline. Blocking user requests to run quality checks adds latency without adding value—the user already has their response.
NO → Set up alerts.
Start with the highest-impact alert: quality score drops more than 10% below baseline. That single alert catches the most common failure mode—gradual degradation that nobody notices. Add cost alerts at 50%, 80%, and 100% of budget as a second step.
Gate 4: Runbook for When Alerts Fire?
Alerts are firing. Does someone know what to do?
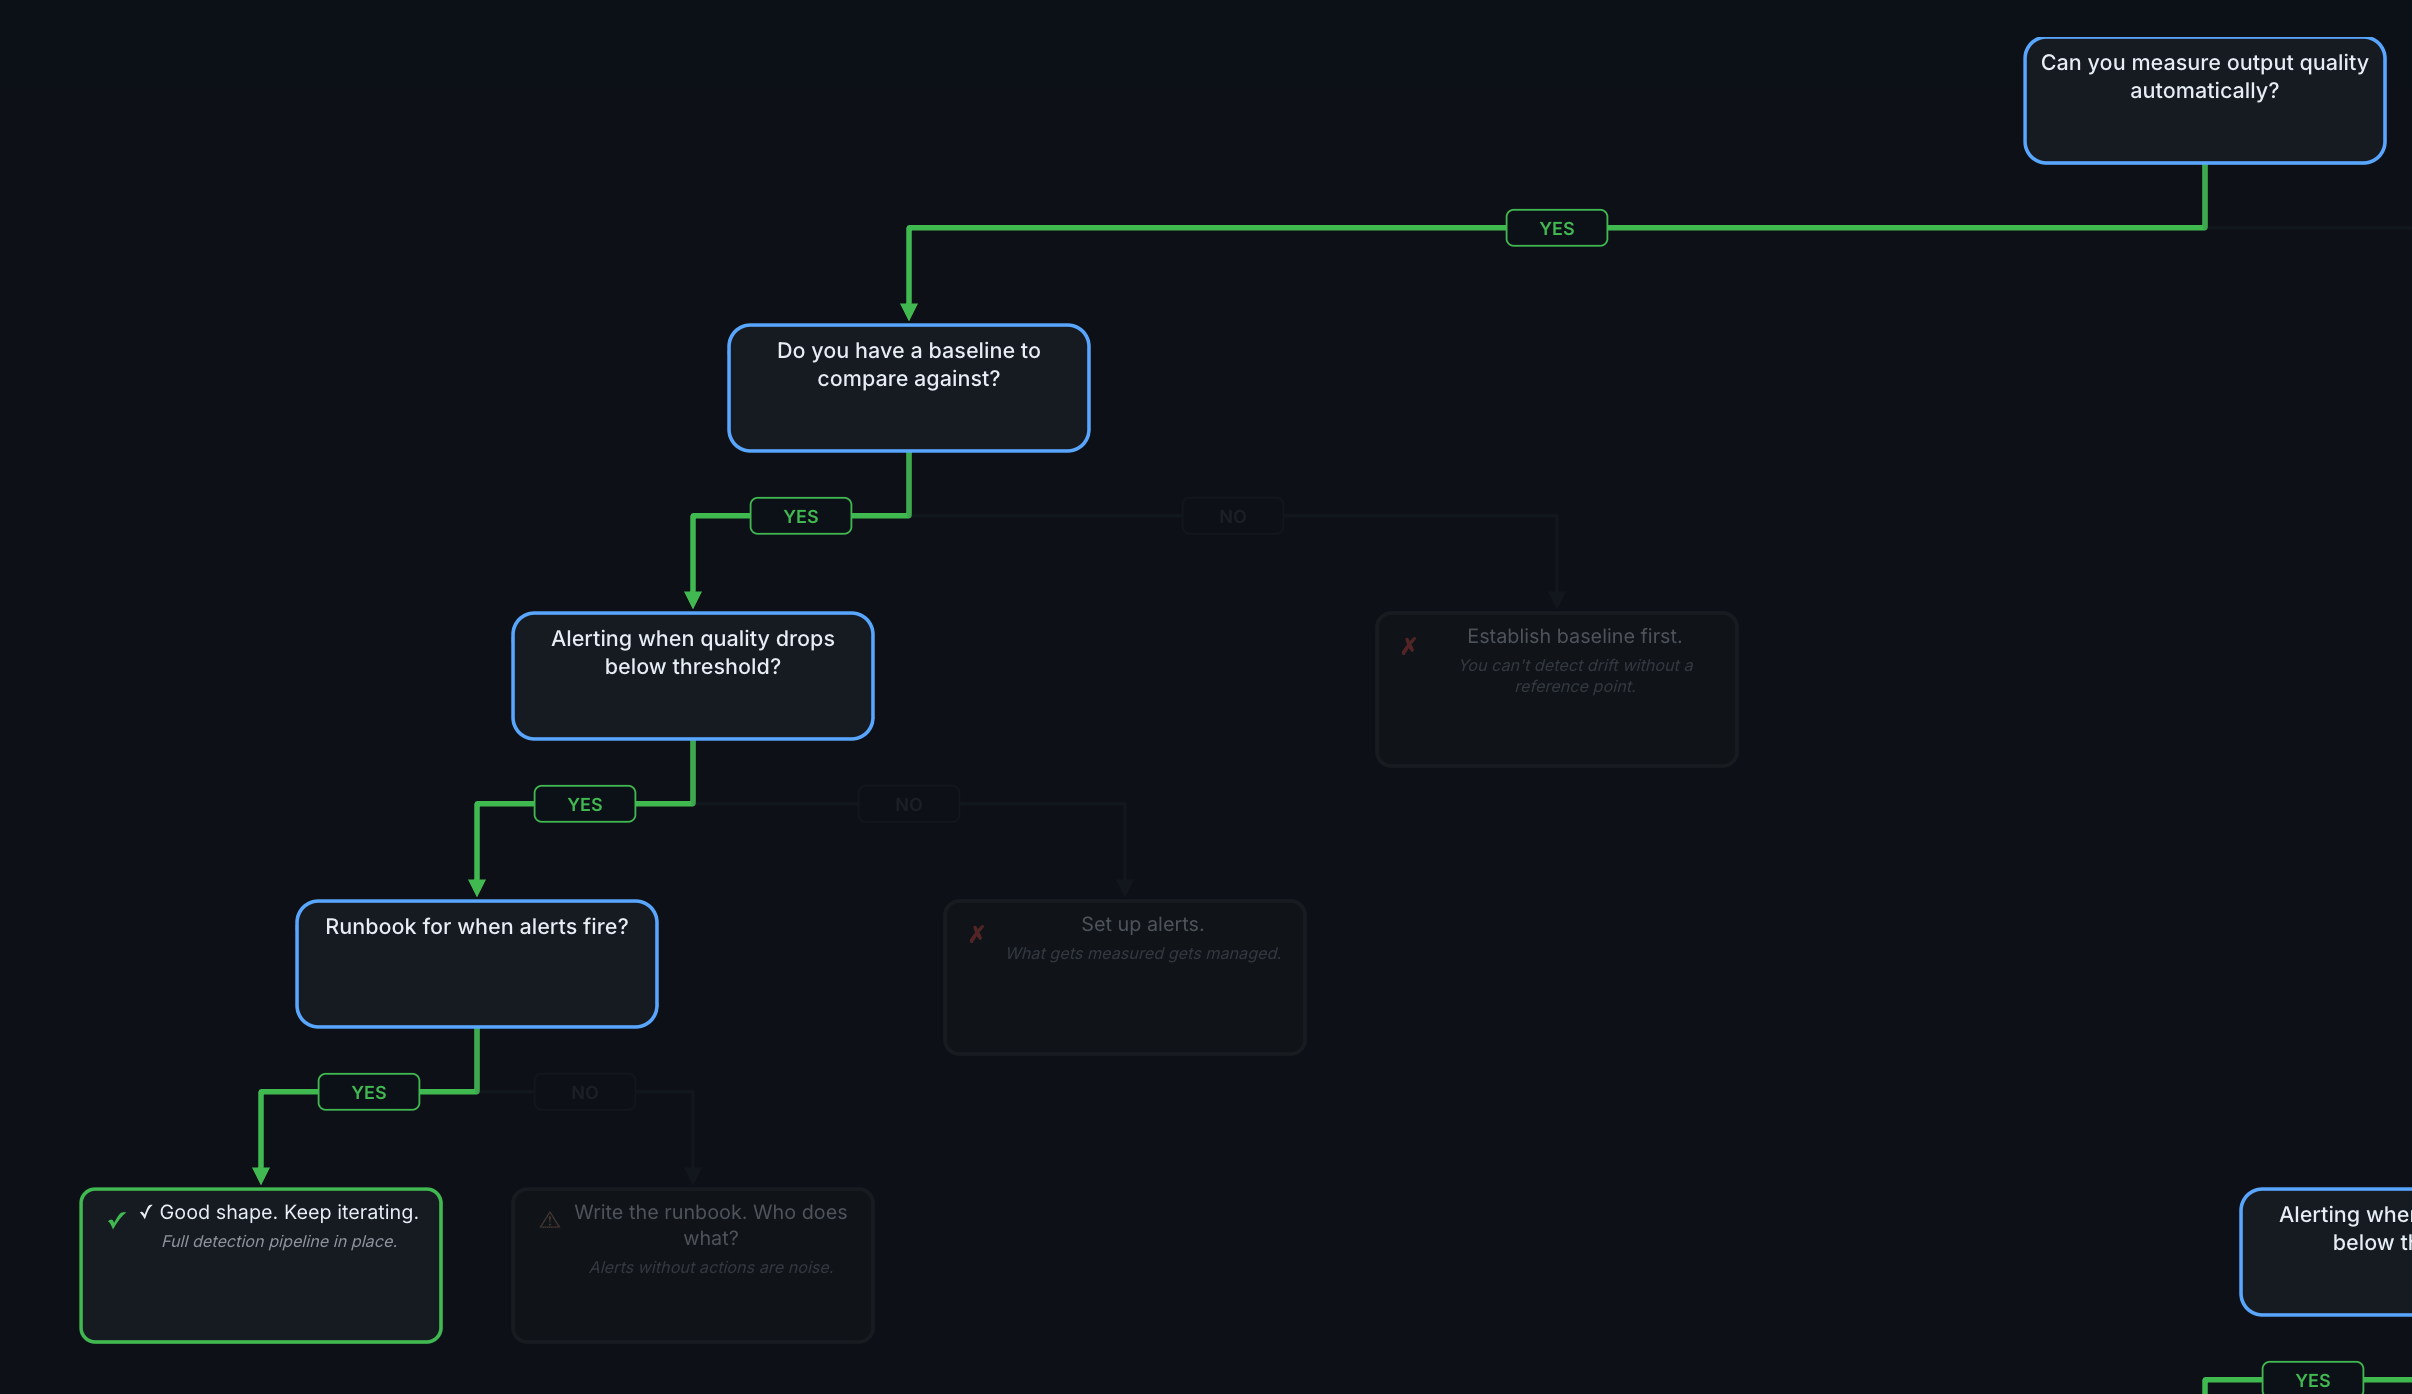
Gate 4. The difference between "good shape" and "missing runbook" is whether alerts lead to action.
YES → Good shape. Keep iterating.
You have a full detection pipeline: measurement, baselines, alerting, and response procedures. The work from here is iterative—tune thresholds, expand coverage to more quality dimensions, reduce detection latency, and review whether your runbook still matches reality.
NO → Write the runbook.
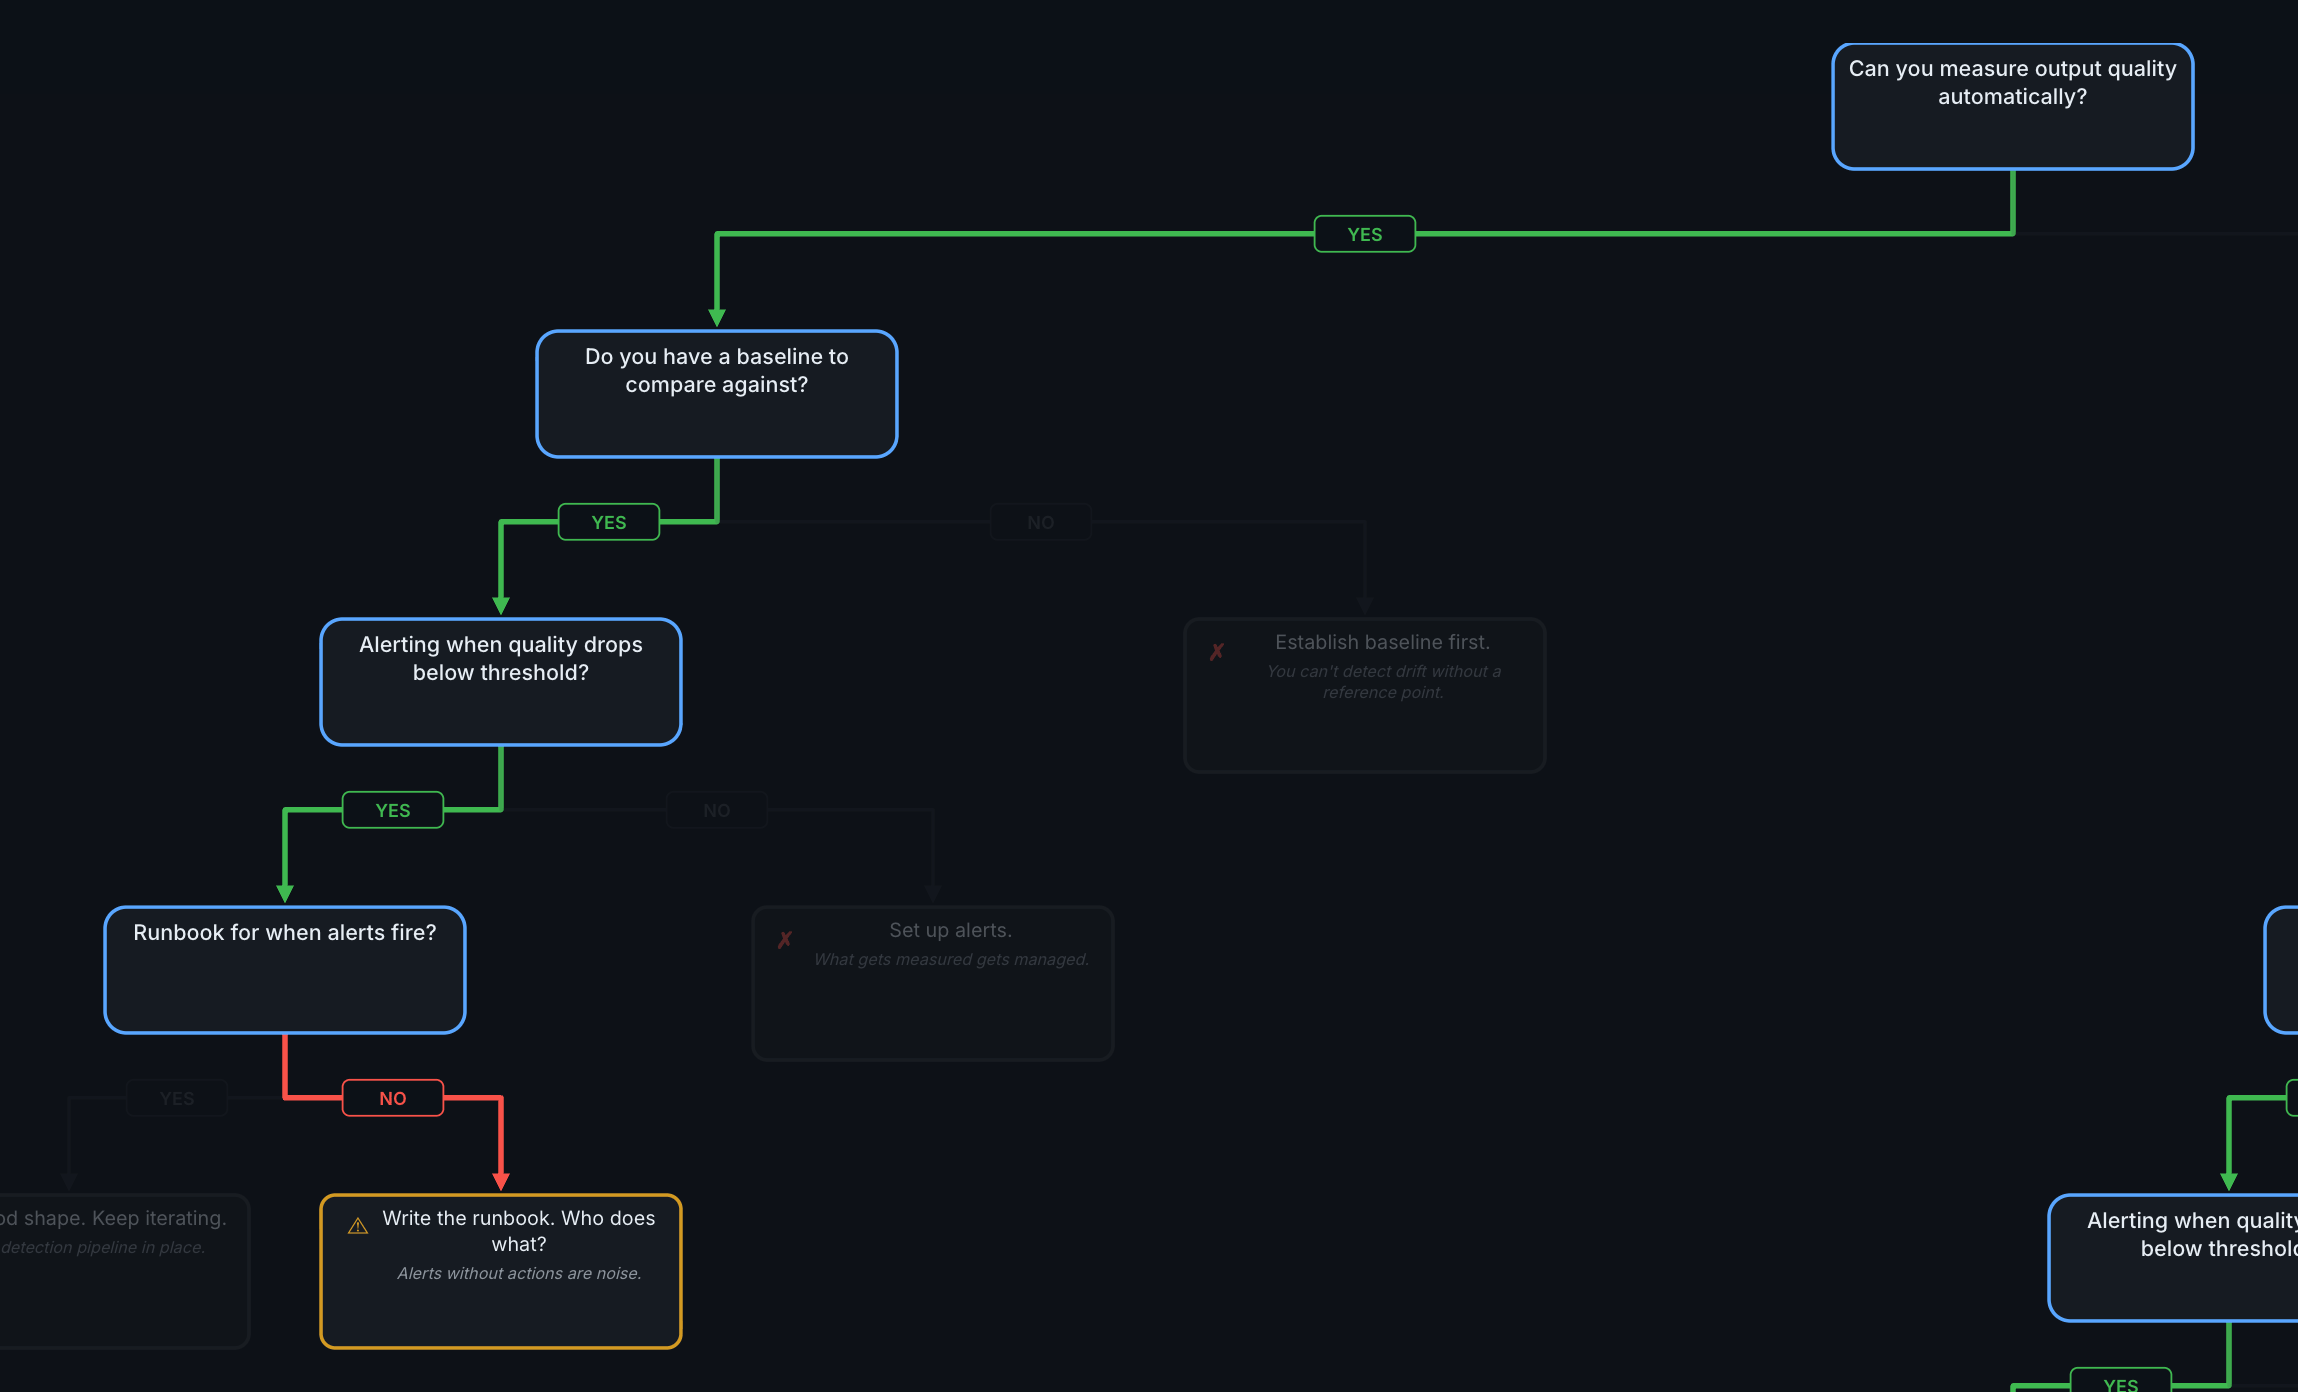
Alerts without actions are noise. A runbook turns an alert into a decision.
A useful containment hierarchy, adapted from the GLACIS incident response framework, orders options from least to most invasive:
Traffic throttling — reduce volume while investigating
Shadow mode — log production traffic but use a fallback for actual decisions
Feature flag disable — turn off the AI feature, keep the rest of the app running
Model rollback — deploy the previous known-good version (takes minutes)
Full shutdown — complete service suspension for critical safety or privacy risks
A runbook should cover at minimum:
Who gets paged? Name and escalation path, not just "the team."
What's the triage step? Check recent quality scores, review flagged outputs, compare to baseline.
Which containment level? Match severity to the hierarchy above.
When is the postmortem? Within one to two weeks while details are fresh.
Where You Are vs Where You're Going
A quick self-assessment:
Level | What You Have | What's Missing |
|---|---|---|
0 | Nothing. Ship and hope. | Everything. Start logging inputs/outputs. |
1 | Infrastructure monitoring (latency, errors, cost) | Quality measurement. You know the system is up, not that it's correct. |
2 | Automated quality checks + baselines | Drift detection and smart sampling. You measure quality but can't detect slow degradation. |
3 | Drift detection + CI/CD integration + targeted sampling | Incident response. You detect problems but don't have a playbook for fixing them. |
4 | Comprehensive detection + containment hierarchy + postmortems | Keep iterating. Tune thresholds, expand coverage, reduce detection latency. |
You don't need Level 4 on day one. Most teams starting their first AI feature should aim for Level 1 at launch and Level 2 within the first month—though the timeline depends on stakes. A customer-facing support bot may need Level 2 before launch; an internal summarization tool can afford to build toward it. The goal is knowing where you are and what you're deferring.
What's Next
This post covered detection—how to know when something is wrong. The next posts in the series cover what to do about it:
When Do I Need Human Review? — Where humans belong in the pipeline. Some decisions need automated checks. Some need human judgment. The decision depends on the cost of wrong answers and the reversibility of the decision.
Silent Failures Make Me Most Nervous — The six-month degradation timeline. What happens when detection is in place but the world changes around it—data drifts, user patterns shift, and the checks that were calibrated at
launch slowly become irrelevant.
Reply