- Prompt/Deploy
- Posts
- Silent Failures Make Me Most Nervous
Silent Failures Make Me Most Nervous
The degradation timeline. How AI systems fail slowly without anyone noticing—and how to catch it.
Hou C.
March 19, 2026
This post is part of the Mental Models for Production AI series, which explores the mental frameworks needed to evaluate, build, operate, and improve AI-powered features—focusing on practical decision-making.
What makes me most cautious about AI features? Silent failure. The system looks fine—logs are clean, latency is normal, error rate flat. But the outputs are quietly getting worse. Users don't file bug reports for "slightly less helpful." They just stop trusting the feature.
The previous post walked through four gates for setting up failure detection. This post is about what you're detecting against: the slow, invisible quality erosion that is the default trajectory for AI features in production.
That gap—between how often models degrade and how rarely anyone is watching—is what makes silent failure the default for most teams, not the exception. Teams with tight feedback loops and active user interaction may catch drift faster, but most production AI features don't have that luxury.
Why Traditional Monitoring Misses This
If you've shipped a web service, you know the standard monitoring stack: latency percentiles, error rates, uptime, cost. Those metrics cover the infrastructure layer. They'll tell you the service is up and responding within SLA.
They won't tell you whether the responses are correct.
According to the GLACIS AI incident response framework, 67% of AI incidents stem from model errors rather than adversarial attacks. The majority of failures look perfectly healthy from an infrastructure perspective. Your dashboards are green. Your PagerDuty is quiet. Your AI feature is confidently returning wrong answers.
The analogy I keep coming back to: it's like monitoring that a restaurant is open, fully staffed, and serving food within 10 minutes—but never tasting the food. Every operational metric looks great. The kitchen is producing garbage.
Traditional monitoring creates a false sense of security for AI features. Infrastructure metrics still matter—you need them as a foundation. But the metrics that matter most for AI quality—output correctness, relevance, faithfulness to source material—require a different kind of measurement on top.
The 6-Month Degradation Timeline
Here's a timeline for how this might play out. The specifics vary by domain—a fraud detection model might drift in weeks due to evolving tactics, while a document summarizer might hold steady for a year. But the general shape is remarkably consistent across most AI features.
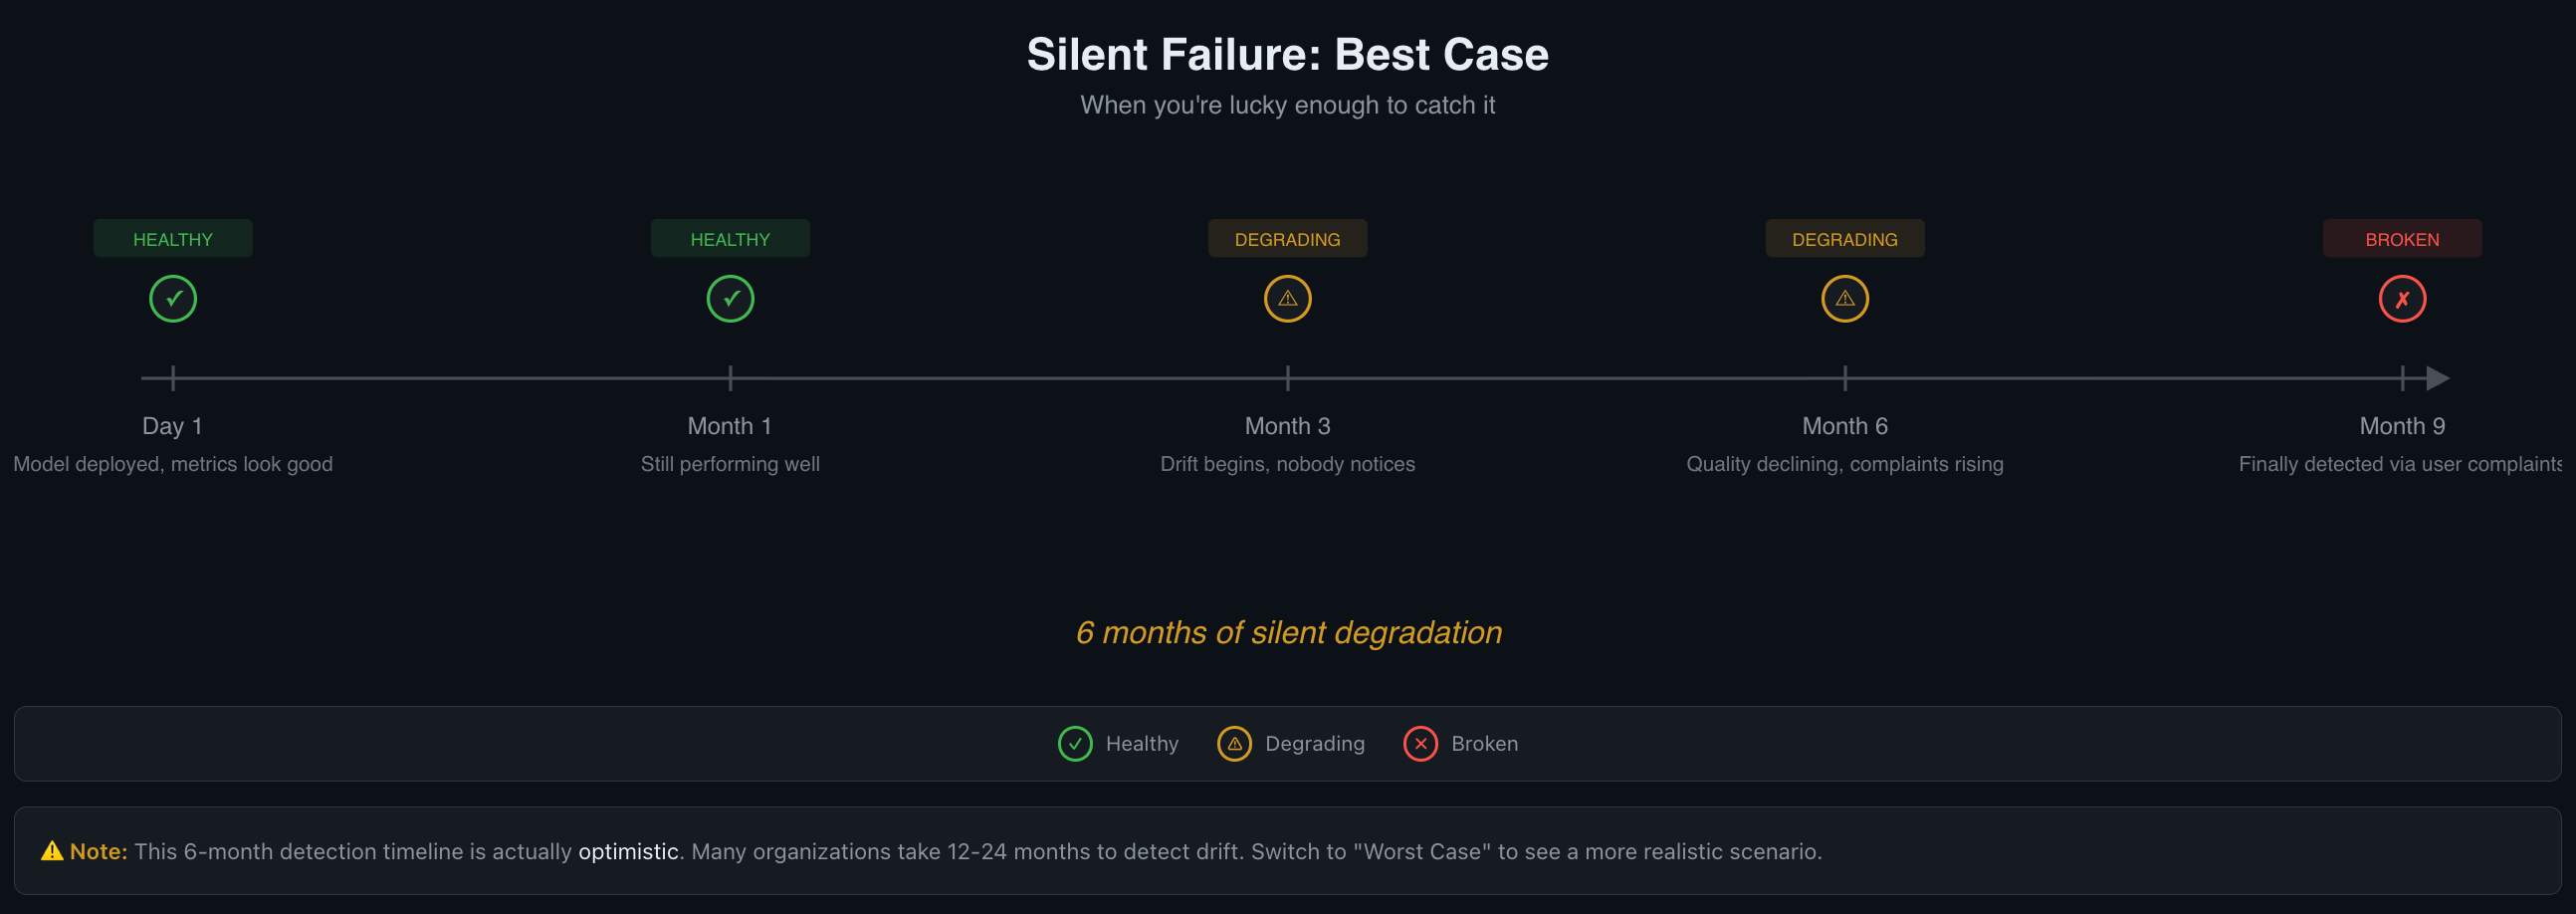
The 6-month timeline is actually optimistic.
Many organizations take 12-24 months to detect drift.
Day 1: Everything Looks Good
Model deployed. Baselines established. Evals passing at the rates you expected. Users are getting value. This is roughly the best your system will perform without active maintenance. The world it was trained or tuned against is frozen in time. The real world is not.
Month 1: Still Performing Well
Metrics are holding steady. No complaints. It's tempting to move on to the next feature. But the world outside your system is already shifting. User demographics change. Source documents get updated. Upstream APIs return slightly different data. Seasonal patterns shift behavior. Each change is small enough that no single day looks different from the last.
Month 3: Drift Begins, Nobody Notices
By now, the data distribution has shifted meaningfully. New user segments are sending inputs your system hasn't seen before. The documents your RAG pipeline retrieves have been updated—but your embeddings haven't been refreshed, so the system is grounding on increasingly stale relevance scores.
Quality is declining by small increments. Each day looks fine compared to yesterday. Each week looks fine compared to last week. This is the boiling frog problem: gradual change is invisible when you only compare adjacent data points.
If you're tracking quality metrics against your Day 1 baseline, the trend is visible. If you're only looking at infrastructure dashboards, everything still looks green.
Month 6: Quality Declining, Complaints Rising
Users are noticing inconsistencies. Support tickets are increasing—but slowly, and about vague things. "The AI gave me a weird answer" doesn't get prioritized the same way as "the page crashed."
The gap between what the system should do and what it actually does has compounded over months. By the time the trend is obvious, trust erosion has already happened. And recovering user trust is harder than maintaining it.
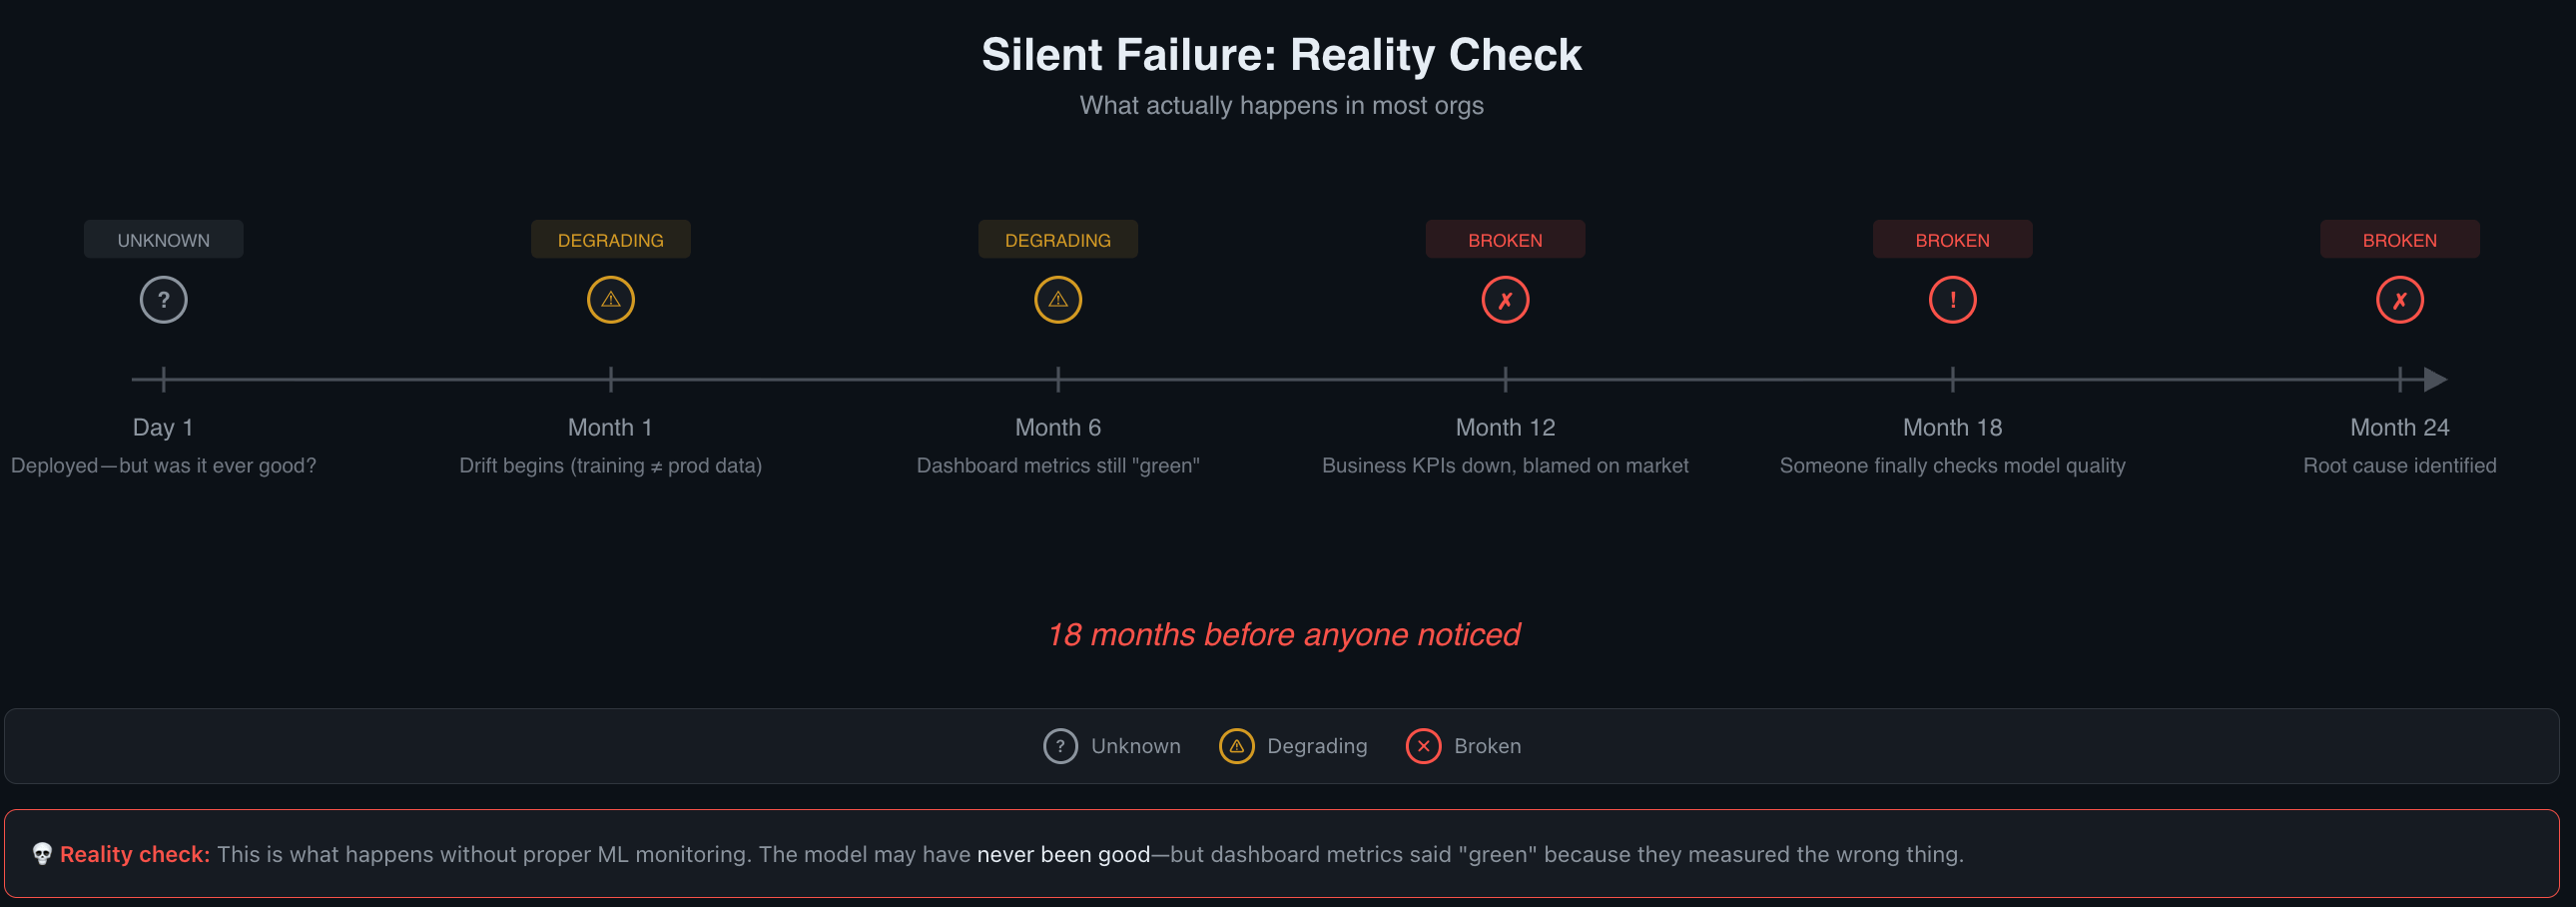
Worth noting: six months is an optimistic detection timeline. The Nature Scientific Reports study found degradation under minimal drift. In organizations without proactive monitoring, 12-24 months of silent degradation is common.
Five Things That Drift Without Warning
Understanding what drifts helps you know where to look. Here are the five most common sources of silent degradation, roughly ordered from most to least visible.
1. Data Drift
The statistical distribution of your inputs changes. Your model is still sound—it just operates on data that looks different from what it was trained or tuned on. An Evidently AI analysis gives a clear example: a marketplace propensity model trained primarily on paid-search users encounters a surge of social-media-sourced users. The model's logic
is fine; the population shifted.
2. Concept Drift
The relationships between inputs and outputs change. The patterns the model learned no longer hold. Economic shifts change what "creditworthy" means. A pandemic changes what "normal demand" looks like. Concept drift can be gradual (competitors launch products, conditions shift over months), sudden (a policy change overnight), or recurring (seasonal patterns your model wasn't exposed to).
3. Upstream Data Quality
Your model is the same. Its food changed. Source documents get stale, APIs start returning different schemas, databases accumulate garbage. For RAG systems, this is particularly sneaky: the model produces fluent, well-structured answers grounded on increasingly irrelevant or outdated context. The output looks good. The content is wrong.
4. Accumulating Small Changes
Each prompt edit seems harmless. Each parameter tweak, each new tool integration, each minor config change. But without versioning and regression testing, these compound. Three months of "small tweaks" can produce a system that behaves quite differently from what was originally validated—and it's hard to trace back when the regression started.
5. Third-Party Model Updates
Your LLM provider pushes a new model version. Your prompts were tuned for the old version's behavior. The new version interprets instructions slightly differently—maybe more literally, maybe less. Your evals may or may not catch it, depending on how sensitive they are to output style versus correctness.
Drift Type | Detectability | Typical Damage | Best Detection Method |
|---|---|---|---|
Data drift | Medium — input distributions are measurable | Medium — model is sound but misapplied | Distribution monitoring |
Concept drift | Hard — the relationship itself changes | High — model logic becomes wrong | Quality metric trends against baseline |
Upstream data quality | Medium — if you monitor data sources | High — outputs look correct but are grounded on bad data | Source freshness checks, embedding drift |
Accumulating changes | Hard — each change is small | Medium-High — compounds over time | Version control + regression suites |
Third-party model updates | Easy — if you track provider changelogs | Variable — depends on prompt sensitivity | Before/after eval comparison on model updates |
Detection Strategies: Catching What Dashboards Miss
Here's what I'd want to have in place, organized by effort level. Start at Level 1 and add layers over time.
Level 1: Regular Transcript Review (Lowest Effort)
Sample live outputs weekly and read them. Hamel Husain puts it directly: "You are doing it wrong if you aren't looking at lots of data."
Even 15 minutes per week of reading actual model outputs catches things automated checks miss. You develop intuition for what "good" looks like, and you notice when outputs start feeling off—before metrics confirm it. This is also the fastest way to calibrate whether your automated evals are measuring the right things.
Level 2: Regression Suites (Medium Effort)
Build a set of golden conversations—known-good input/output pairs that represent your feature's core behaviors. Add domain-specific QA sets tied to your product's critical paths. Run these on every change to prompts, models, or RAG configuration.
One useful heuristic from Hamel Husain's eval framework: if you're passing 100% of your evals, you're probably not challenging your system enough. A 70% pass rate on
well-designed evals often indicates more meaningful coverage than a green checkmark on easy tests.
Level 3: Semantic Signal Tracking (Medium-High Effort)
Move beyond binary pass/fail to continuous quality signals:
Hallucination rates — track the percentage of outputs containing unsupported claims
Factual-error rates — compare outputs against known-correct answers on sampled traffic
Business KPI correlation — tie AI quality metrics to downstream signals (support ticket volume, task completion rates, user re-engagement)
For production traffic where reference outputs don't exist, LLM-as-judge evaluation lets you score outputs at scale. The cost is typically $0.01–0.10 per evaluation—cheap enough to run on 5-10% of traffic continuously.
Level 4: Canary and Shadow Deployments (Highest Effort)
Compare semantic outputs from a new configuration against validated baselines before routing full traffic. This is the most thorough option for catching regressions before users see them, but it requires infrastructure to run parallel pipelines and compare results.
Anthropic's evaluation guide frames this as a "Swiss Cheese Model": no single evaluation layer catches every issue. Stack multiple methods so failures that slip through one layer are caught by another. User feedback is "sparse and self-selected" and "skews toward severe issues"—it won't catch gradual degradation on its own.
A Minimum Viable Detection Setup
To move from "flying blind" to "aware" with the least effort, here's what I'd do first.
Step 1: Establish baselines now. Run your eval suite (or even just manual review) on current outputs and record the scores. This snapshot becomes your reference point. Without it, you can't detect drift—there's nothing to drift from.
Step 2: Set up weekly transcript sampling. Pick 20-50 random outputs per week and read them. Log your impressions. Even informal notes like "answers seem less specific this week" create a paper trail you can reference later.
Step 3: Track at least one semantic quality metric. Pick the metric that matters most for your feature—relevance, faithfulness, helpfulness—and track it alongside your infrastructure metrics. One number, plotted over time, makes drift visible.
Step 4: Version your prompts and RAG configurations. Store them in version control so you can diff when things change. When quality drops, the first question is almost always "what changed?"—and without versioning, you can't answer it.
Step 5: Set a monthly baseline comparison. Calendar reminder. Pull current eval scores, compare to your Day 1 baseline. A sustained 5-10% drop is worth investigating. A 15%+ drop is worth treating as an incident. These thresholds depend on how much your metric naturally varies—a noisy metric needs wider bands to avoid false alarms.
What This Means for Your System
Silent failure is the default trajectory for AI features. Active maintenance—regular evaluation, baseline comparison, transcript review—is required to avoid it. The cost of that maintenance is a few hours per month. The cost of six months of undetected degradation is user trust, and that's much harder to rebuild.
The next posts in the series pick up where this leaves off:
Systems That Don't Learn, Decay — Why continuous learning and feedback loops determine whether your AI feature improves or quietly rots. The Learn Layer of the mental model framework closes the loop.
When Should I Retrain or Tune? — A decision tree for knowing when quality drops call for prompt fixes, retraining, or deeper investigation.
The scariest failures aren't the ones that page you at 2 AM. They're the ones that never page you at all.
Reply